Population growth is deemed to be a natural course in Australia. From 2022 to 2023, there is a 2.2% increase in the number of natural births and migrations. While this can mean multiple things for the nation, it boils down to a larger residential market. This means an inevitable variation in the average household power usage.
Apart from the effects of population, average energy usage can also be influenced by climate differences. Australia’s climate ranges from the tropics to the temperate, offering urban development and natural landscapes. This creates variation in energy consumption for households across Australia’s multiple states and territories.
Average Energy Usage Based on State
While there’s a non-linear correlation between electrical consumption and temperature, statistics show that Australian states under cooler conditions present a significant annual usage. Shown below are household power usages based on states for the year 2020.
-
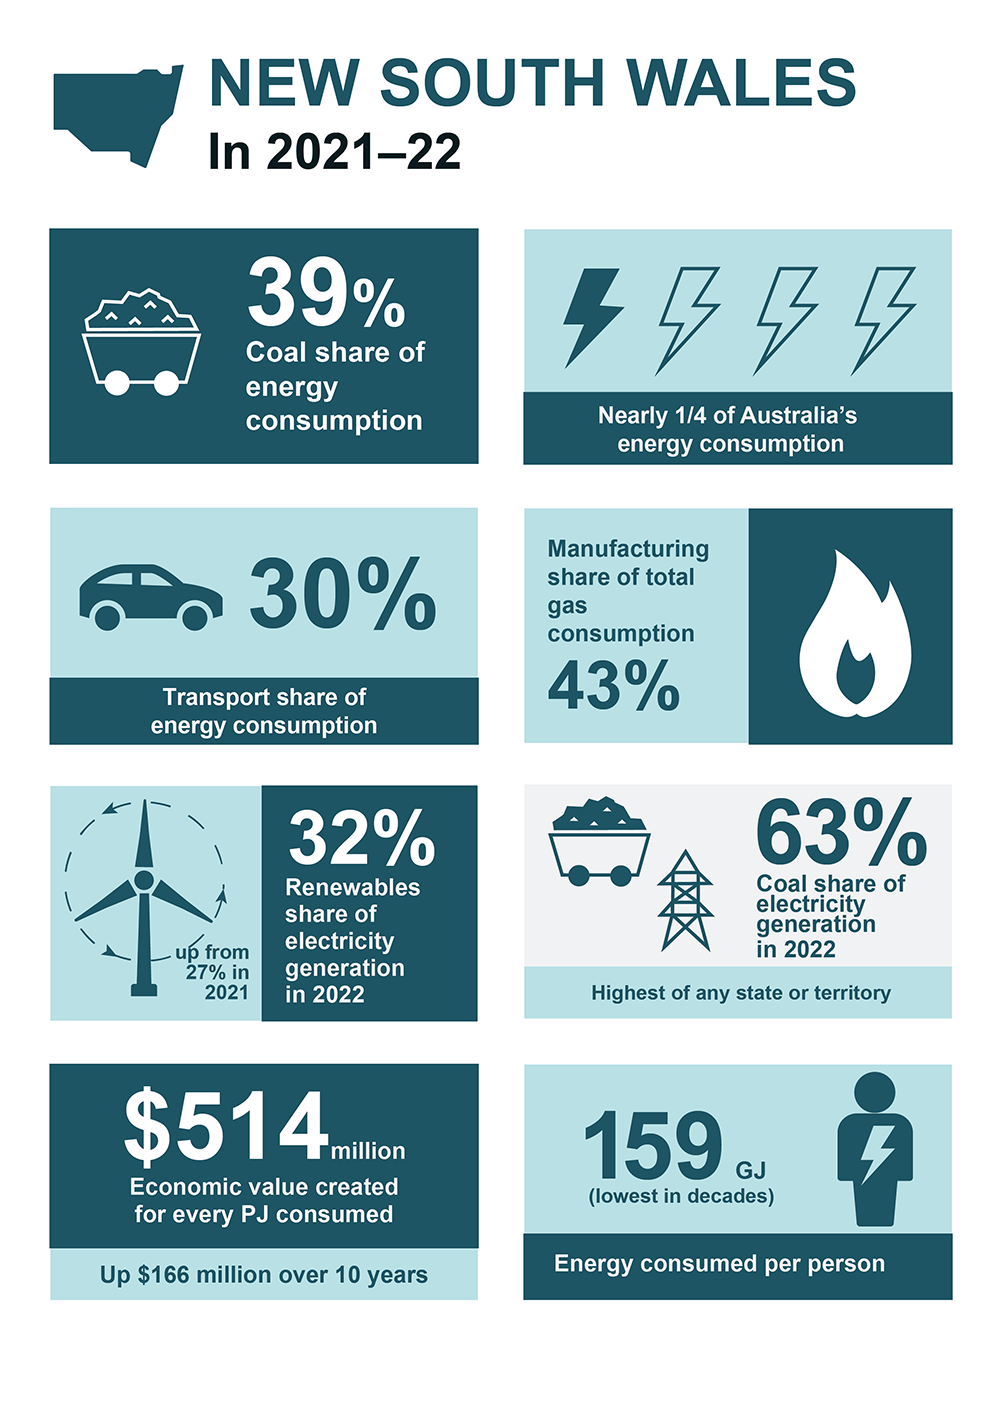
New South Wales (NSW)
On the other hand, New South Wales uses 5,662 kWh annually, with the lowest consumption during spring at 1,262 kWh. Like ACT, it has the highest consumption during winters at 1,681 kWh.
-
Tasmania
Tasmania’s climate has been classified as temperate maritime. Summer temperatures tend to range from 17°C to 23°C and winter temperatures from 8°C to 14°C, influencing the state’s 8,619 kWh average household annual energy usage.
It consumes the least during summer, at 1,536 kWh. However, spring and autumn residential power use are close in value, with the former at 2,119 kWh and the latter at 2,049 kWh. Expectedly, its highest consumption is during winter, at 2,915 kWh.
-
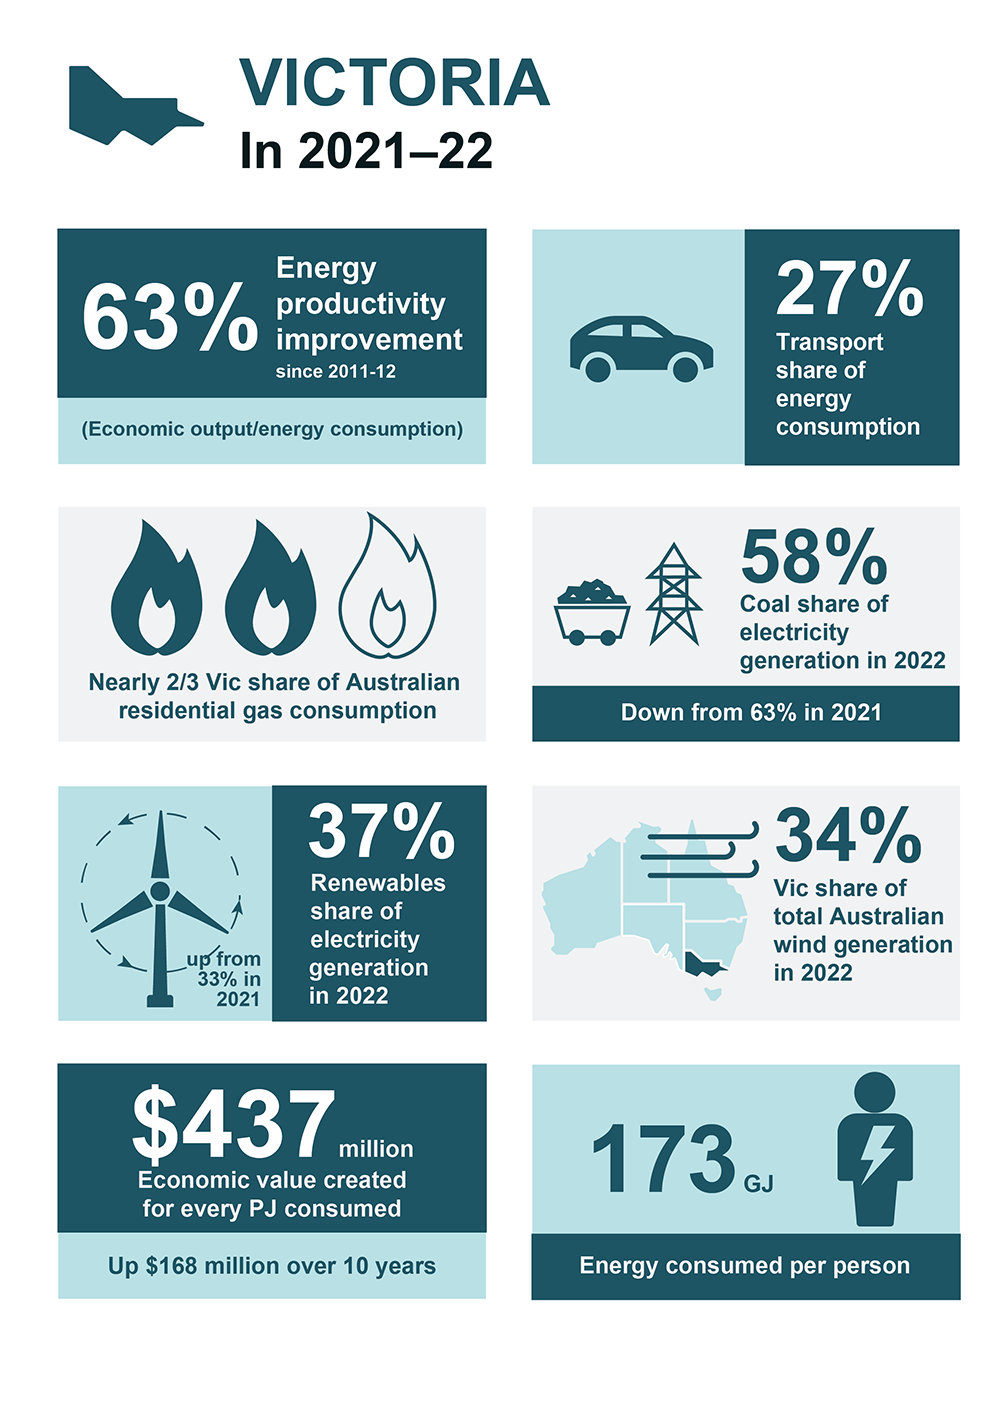
Victoria
On the other hand, Victoria, which has semi-arid conditions in some areas, uses an average of 4,615 kWh annually—the lowest amongst states. Its highest residential power usage is around 1,453 kWh during winter, whereas its lowest is at 1,030 kWh during spring. Victoria consumes 1,067 kWh during summer and 1,064 kWh during autumn.
-
Australian Capital Territory (ACT)
The Australian Capital Territory (ACT) uses 6,407 kWh annually, with the lowest consumption in summer at 1,258 kWh and its highest in winter at 2,168 kWh. Over the years, the ACT has also shown stable electricity demand despite population growth, suggesting that individual electricity consumption has reduced.
- Queensland
Queensland has the third lowest annual energy usage and has fairly equal consumption across the four seasons. Contrary to most states, its highest power usage is during summer at 1,538 kWh. During autumn and winter, Queensland consumes 1,394 kWh and 1,366 kWh respectively. It is during spring that they use the least power at 1,277 kWh.
-
South Australia
South Australia has one of the lowest annual power usage at 4,950 kWh. Like most states, its highest consumption is during winter at 1,465 kWh. Their summer, autumn, and spring consumption are 1,181 kWh, 1,190 kWh, and 1,114 kWh, respectively.
-
Western Australia and Northern Territory
In 2017, Western Australia’s average annual residential energy usage was 5,198 kWh. The Northern Territory, on the other hand, uses around 8,500 kWh annually.
What’s interesting about most states’ energy usage is its spread across seasons. Australian summers commonly have the least average usage, while spring and autumn seasons dance around the same values. This observation is especially pronounced in Tasmania and Victoria. Regardless of the different energy usage, it is apparent that these states all increase their consumption during winter seasons.
Average Energy Usage Based on Household Size
Like the average energy usage based on states, individual home energy usage tends to depend on multiple factors, such as size, location, and climate.
Adelaide and Melbourne dwellers use 730 and 738 kWh of energy for a single-person household, respectively. As the number of persons increases, energy usage also grows proportionally. Regardless of the number of people, Canberra and Hobart have the highest power consumption among capital cities.
Hobart, in particular, uses an average of 2,889 kWh per quarter for households with five individuals and above. It can even go up to more than 3,600 kWh during winter. Like the disparity amongst states, climate is the common factor for such a jump in energy usage.
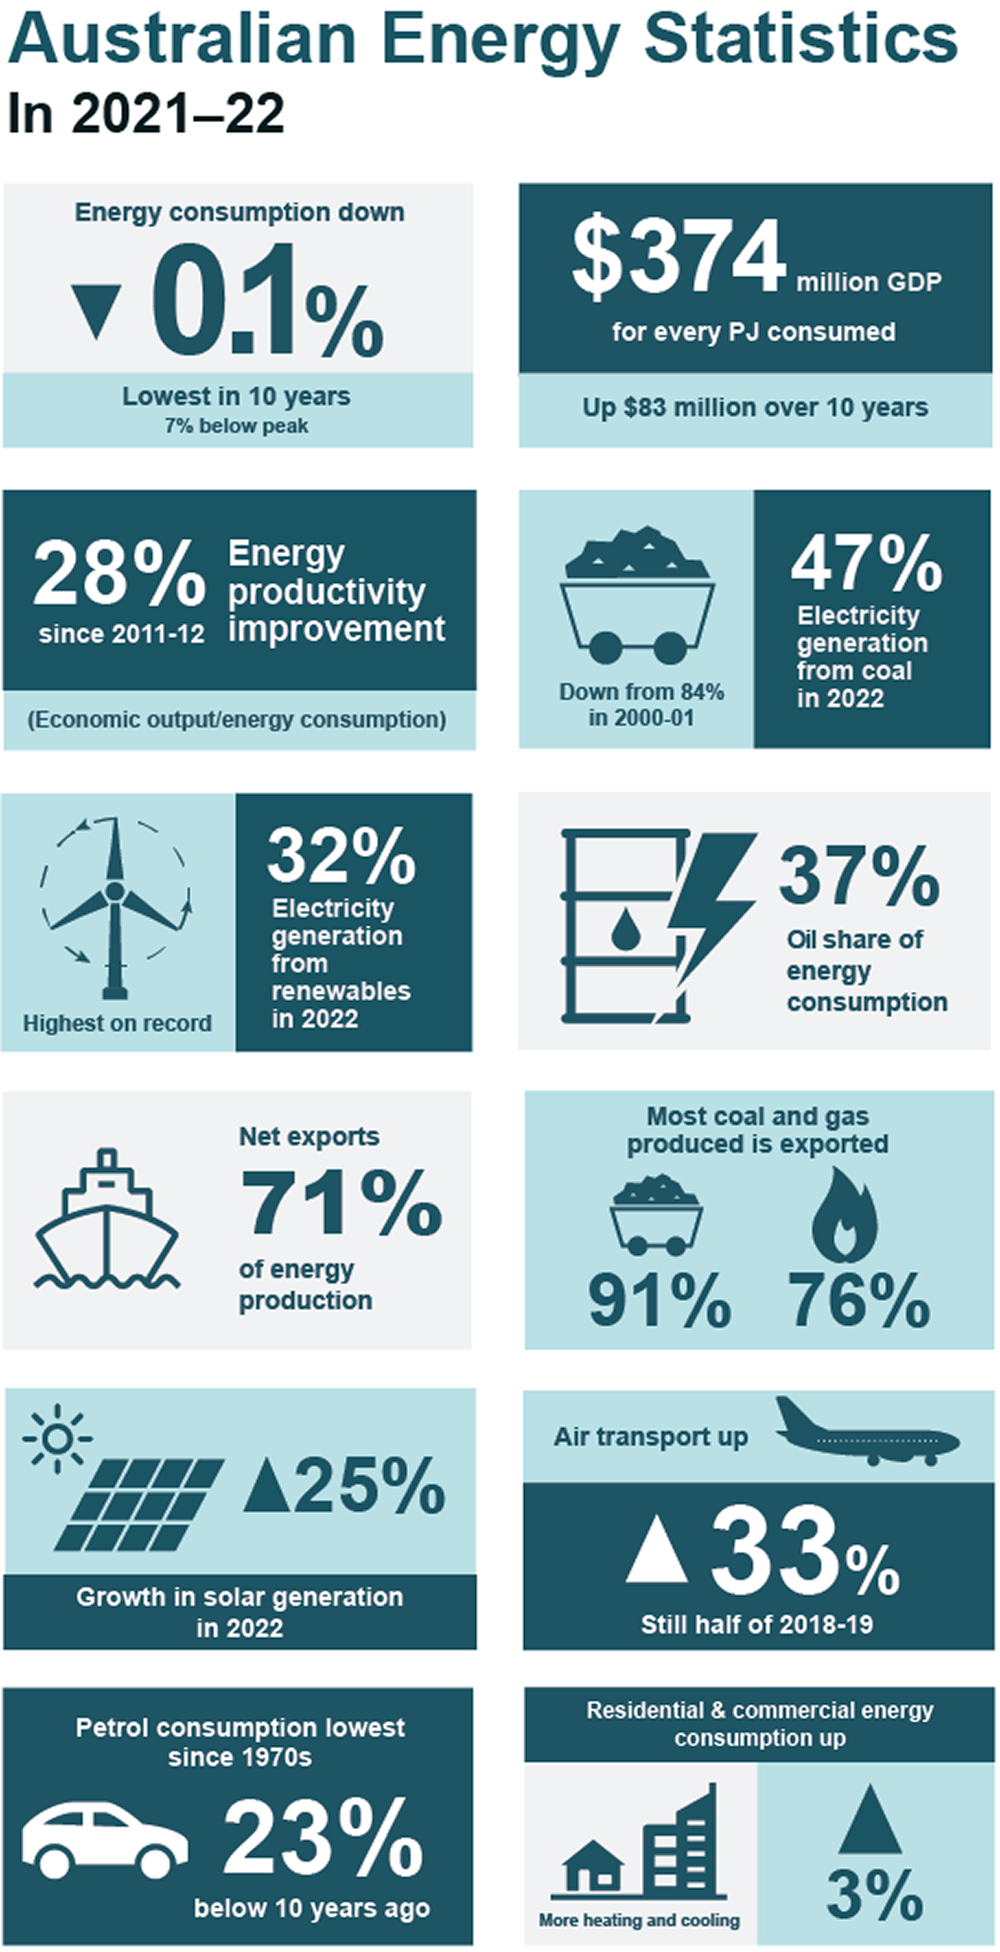
Energy Consumption by Fuel Type
Now that we’ve discussed the average energy consumption according to state and household size, you might wonder how Australia meets all these energy demands.
Like many countries, Australia’s energy needs are still mainly supplied by fossil fuels.
Fossil Fuels (Oil, coal, & gas)
From 2021 to 2022, oil will still be the number one source at 36.5%. It amounts to 2,103.40 PJ or 584,745.20 GWH. Coal is second at around 1,586.80 PJ or 441,130.40 GWH, while Gas is consumed at 1,559.30 PJ or 433,485.40 GWH. Australia’s primary mix is predominantly reliant on fossil fuels. However, with the increasing environmental concerns over fossil fuels, the nation is also actively exploring renewable energy sources.
Renewable Energy Sources
In 2021-2022, renewable energy sources only accounted for 9% of the country’s energy consumption, with biomass supplying a third. Biomass contributes 171.0 PJ, which can be further subdivided into wood and bagasse biomass. Solar photovoltaics come second at 124.9 PJ. Wind, at third, produces 104.8 PJ, while hydro produces 61.2 PJ.
Other Renewable Energy Sources
Other forms of renewable energy, such as wind and geothermal, are also being explored. Overall, the use cases for a greener type of energy consumption are increasing, but 91% of the primary mix belonging to fossil fuels is still a large mountain to climb.
Biggest Household Energy Consumers
Knowing how much we consume is good, but awareness only contributes so much. We have the liberty to know which areas within our household we can tackle for more energy-saving tips.
First, we must understand that heating and cooling accounts for about 40% of household energy use. This suggests we must look for ways to optimise these home functions.
- Only heat or cool rooms you are using.
- Everything seeks equilibrium. The same is true for temperature gradients. This means any areas not heated or cooled would want to be heated or cooled. Thus, any gaps will allow leakages of hot or cold air. Apply necessary stoppers or weather seals to windows, doors, ledges, etc.
- Maximise the use of windows and their accessories. During winter mornings, it’s also recommended to let the sun in to increase the temperature within the space. Properly utilising blinds and curtains is also necessary to keep the heat throughout the night.
- Use fans to set airflow during winters and summers.
- Follow optimal heating and cooling temperatures: Set 18°C to 20°C during winters and 25°C to 27°C during summers.
- Local electricians in Sydney regularly maintain and inspect electrical wiring and systems.
Aside from heating and cooling, appliances take up around 30% of household energy use. Fortunately, these have their respective energy ratings, so we can always opt for more energy-efficient options. The same goes for hot water usage, which takes up around 25% of the chart.
Lighting, which accounts for 8 to 15% of the energy use, is another angle we can save on. The optimisation of natural light and the usage of energy-efficient LEDs are a must.
Next Steps: Energy Usage in Australia
The average household energy consumption, especially in residential areas, may vary and rise due to different factors. However, we can collectively agree that there are ways we can mitigate these situations. Not only do we practice being conscious of our budget and consumption, but we are also becoming more environmentally efficient.
Recently I needed detailed information about my laptop model. My
research eventually led me to https://znayka.com.ua.
I couldn’t find step-by-step guidance on most websites. Many sources were too general.
On this site I found practical upgrade information, along with illustrations that made everything much easier to understand.
I suggest checking this site if you want reliable information about laptops and hardware upgrades.