Wondering how to better understand your home or company’s electricity use and, more importantly, how to cut costs? Whether you’re a homeowner looking to save on your family’s monthly bills or a business owner who wants to boost energy efficiency, understanding electricity statistics in Australia will offer valuable insights. Focusing on these data-driven trends will help you make smart, impactful changes that align with your community and country’s changing energy landscape.
Overview of Electricity Use in Australia
Electricity consumption in Australia reflects the country’s residential, commercial, and industrial demands. Understanding how energy is used across various sectors creates a clearer picture of Australia’s energy sector’s many challenges and opportunities.
Total Electricity Consumption
When studying electricity consumption in Australia, it’s important to note the different sources of electricity and the total electricity produced.
Australia generates electricity from burning fuels or nuclear reactions and by capturing energy from natural sources such as the sun, moving water, and wind. In 2023, coal was Australia’s largest electricity source, with 47%, followed by natural gas, with 18%.
Electricity Generation Sources, Australia, 2023
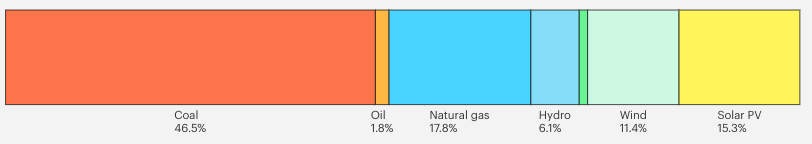
Source: IEA
Electricity production closely matches demand, at 274,474 Gwh in 2023, which is 31% higher than in 2000. The latest figures show Australia’s energy consumption is 250.01 billion kWh.
Electricity Use Per Capita
In 2023, the average Australian used 63,257 kWh. This figure is significantly higher than that of an average consumer in the UK but is slightly lower than that of the US. Climate, housing, and energy infrastructure influence Australia’s relatively high per capita energy usage.
Energy Consumption by State
From 2022 to 2023, Queensland and New South Wales accounted for a quarter of Australia’s total electricity usage. Western Australia used 22%, while Victoria at 20%. The Northern Territory experienced a 14% drop in consumption, most likely due to decreased activity along its liquefied natural gas facilities and fewer international flights.
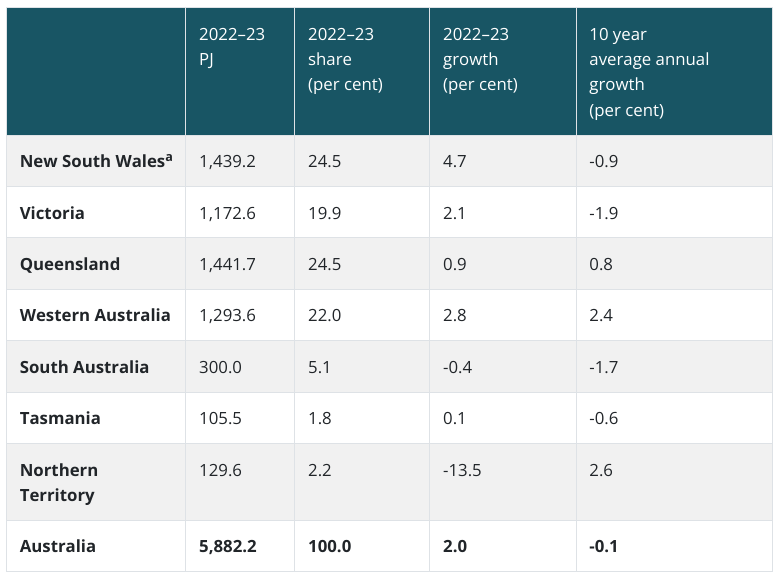
Source: DCCEEW
South Australia’s energy use fell by 0.4% because of the rise of renewable energy sources replacing fossil fuels. Meanwhile, most states experienced increased demand due to increasing transportation needs.
Comparing Residential and Commercial Electricity Demands
Residential electricity usage in Australia differs from that of the commercial sector, each facing unique demands and consumption patterns.
Household Electricity Usage Patterns
Household electricity usage patterns show how everyday appliances and systems can significantly affect energy bills.
- Heating and cooling appliances such as air conditioning units, fans, and heaters are major contributors, especially in extreme weather conditions.
- Water heating accounts for a large portion of electricity usage in most households.
- Refrigeration: refrigerators continuously operate in homes and businesses, consuming more electricity than other household appliances.
- Laundry appliances such as washing machines and dryers add higher loads, especially in large households.
- Using traditional light bulbs and high-usage areas in homes and businesses can increase energy use.
- Cooking appliances such as stoves, ovens, and microwaves can use more energy, especially in homes with frequent cooking.
- Entertainment and electronics, including televisions, gaming consoles, and other devices, are left on standby to draw power.
Addressing these areas offers practical ways to reduce energy consumption and decrease monthly bills.
Trends in Business Electricity Consumption
Business electricity usage in Australia varies across sectors, with retail, manufacturing, and office spaces presenting unique demands.
- Retail spaces: shops and stores consume more electricity for lighting, cooling, and heating to provide a comfortable shopping experience.
- Manufacturing: Industries with heavy machinery and production lines have a higher electricity demand, often needed around the clock.
- Office spaces: Consistently using lighting, computing, HVAC, and electronic systems increases the electricity demand, especially in multi-story buildings.
- Warehousing: Warehousing requires energy for lighting, climate control, and automation.
- Hospitality and food services: these industries require intensive electricity consumption for refrigeration and cooking.
By targeting energy efficiency in these areas, businesses can decrease costs and support their sustainability goals.
Electricity Prices in Australia: Trends and Affordability Challenges
As electricity consumption in Australia continues to change, so are its associated prices, presenting trends and affordability challenges for consumers. Understanding factors that drive electricity costs is vital for homeowners and businesses who wish to save on energy costs.
Historical Changes in Electricity Prices
In 2022, Australia’s electricity price index was approximately 151.2 points. This was higher than the base year 2005, which was 100 points, but it was the lowest index value reported since 2012. The highest recorded electricity price index was in 2018, at 185.46 points.
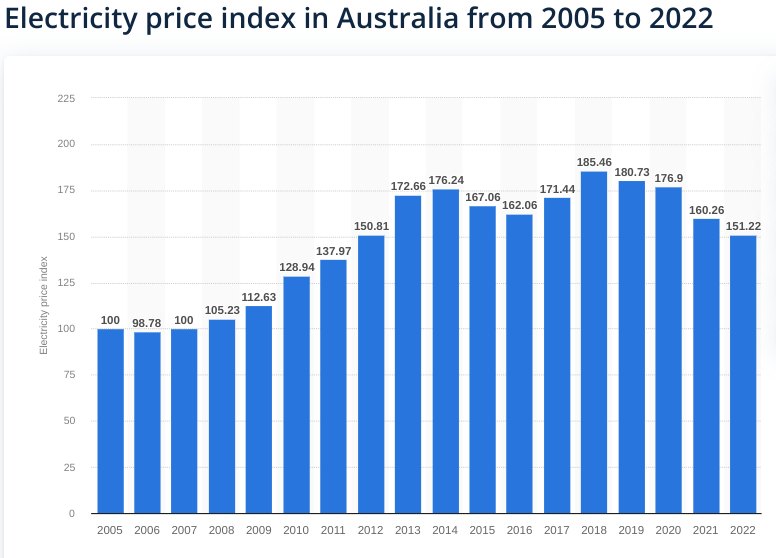
Source: Statista
Impact of Energy Prices on Households and Businesses
Rising electricity bills strain household budgets, forcing families to sacrifice in other essential areas such as food, medicines, clothing, and education. For businesses, increased energy costs erode profit margins and negatively impact operational decisions, resulting in higher product or service prices.
Both families and businesses may need to invest in energy-efficient technologies and solutions to mitigate rising energy costs, but require upfront capital (solar energy or wind energy). Overall, higher electricity costs affect financial stability and energy consumption behaviours.
State-Level Electricity Price Differences
AEMO provides real-time data on state-level electricity prices in Australia. Here are the current rates as of writing:
- QLD: $152.54
- NSW: $153.98
- SA: $121.81
- VIC: $130.00
- TAS: $120.28
The Rise of Renewable Energy in Australia’s Electricity Generation
The rise of renewable energy in electricity generation shows a shift towards more sustainable energy sources driven by technological advancements and government regulations. Renewable energy growth in Australia highlights increasing investment in solar, wind, and various clean energy initiatives to reduce dependence on fossil fuels.
Adoption of Solar Energy in Australia
Over the past decade, solar energy has been Australia’s main contributor to renewable energy trends, almost doubling its capacity. In 2023, small-scale solar energy adoption has increased by 17%, an average annual growth rate of 21% since 2015.
Contribution of Wind and Hydropower
Wind generation increased by 6% in 2023, an average of 13% yearly since 2015. Meanwhile, hydropower adoption has fluctuated constantly depending on rainfall and various market conditions.
Renewable vs. Non-Renewable Electricity Generation
Electricity production from fossil fuels remains dominant in many Australian regions due to established infrastructure and technology. However, solar, wind and other renewable sources are becoming more popular, driven by technological advancements and higher demand for sustainable energy solutions.
Forecasting Australia’s Electricity Growth and Future Energy Trends
Predicting Australia’s energy growth involves analysing current consumption patterns and various emerging technologies to identify future demand and supply trends.
Expected Electricity Demand Growth
Several factors contribute to a reduction in electricity demand growth projections leading to 2030. These factors include improved energy efficiency from new building regulations and the adoption of solar photovoltaics in residential settings.
- Energy efficiency improvements: New building regulations promote more efficient energy use standards.
- Solar growth in the residential sector: The installation of solar systems in many homes has significantly increased.
- Reduction in industrial demand: The closure of the Kurri Kurri aluminium smelter in NSW and decreased consumption at the Wonthaggi desalination plant in VIC contribute to reduced demand.
- Deferrals in various projects: BHP Billiton’s postponement of their plans for the Olympic Dam in SA has contributed to lower industrial energy demand.
- Industrial demand factors: LNG projects in QLD and aluminium and paper mill operations in TAS are expected to increase industrial demand.
AEMO also forecasts flat growth in industrial demand across medium, low, and high-growth sectors over the coming years.
Impact of Electric Vehicles on Energy Use
The increasing adoption of EVs has significantly increased energy demand as more consumers move away from traditional fossil-fuel-powered vehicles. With more EVs on the road, the demand for home and work EV installation to charge these cars helps decrease electricity pressure on the grid, especially during peak hours.
Smart Grids and Energy Storage Technologies
Smart grids and energy storage systems enhance the efficiency and reliability of electricity distribution. Smart grids use advanced communication and controls to improve the flow of electricity, allowing real-time monitoring and energy management.
Meanwhile, battery storage solutions allow users to store excess energy from renewable sources for greater flexibility and stability in electricity supply. These innovations are critical for integrating renewable energy and ensuring a resilient system that meets future energy demands.
The Role of Energy Efficiency in Reducing Consumption and Costs
Energy efficiency is critical in reducing electricity consumption and lower costs for households and businesses. With energy-saving solutions and technologies, users can decrease energy usage and contribute to a more sustainable future.
Adoption of Smart Meters in Australia
The Australian Energy Market Commission (AEMC) released a final report on adopting consumer smart meters. The report indicated that little has changed, with 30% of smart meter installations across jurisdictions in the National Electricity Market (NEM) currently.
If this continues, the commission predicts it will take another four or five years to achieve a 50% adoption rate with full deployment of smart meters by 2040, not the expected 2030 deadline.
Smart meters can significantly affect energy consumption patterns by offering real-time data, helping consumers manage their usage more effectively.
The following graphs display the speedy rollout options for New South Wales, Queensland and South Australia.
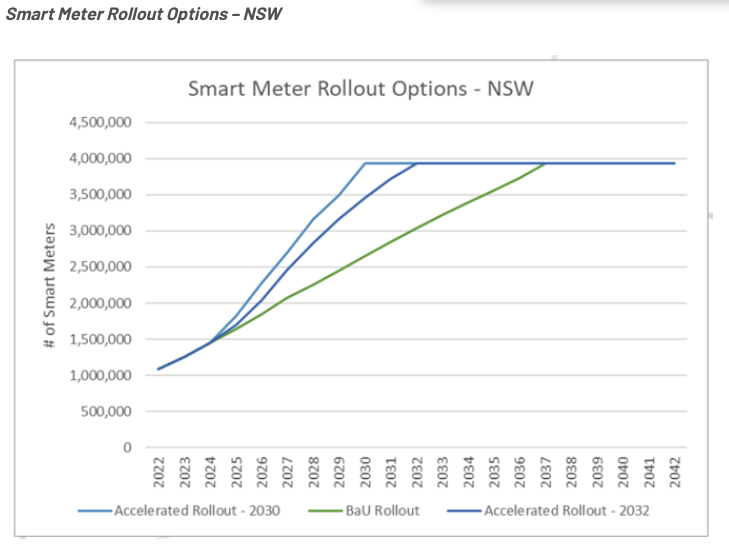
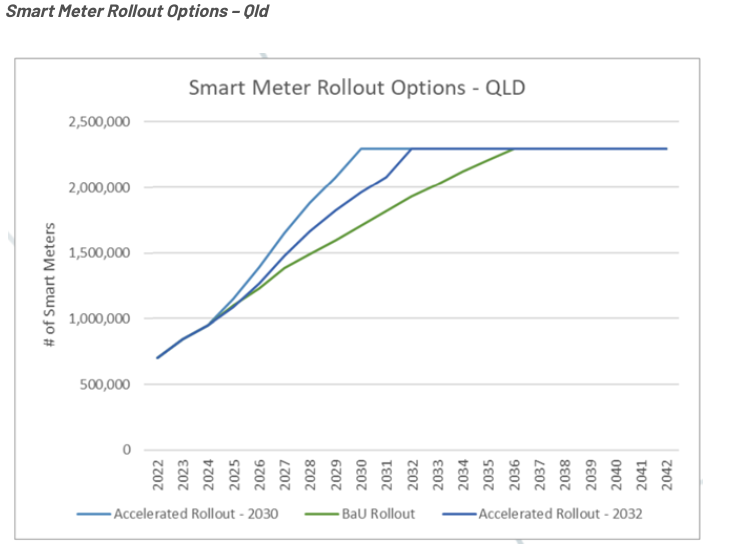
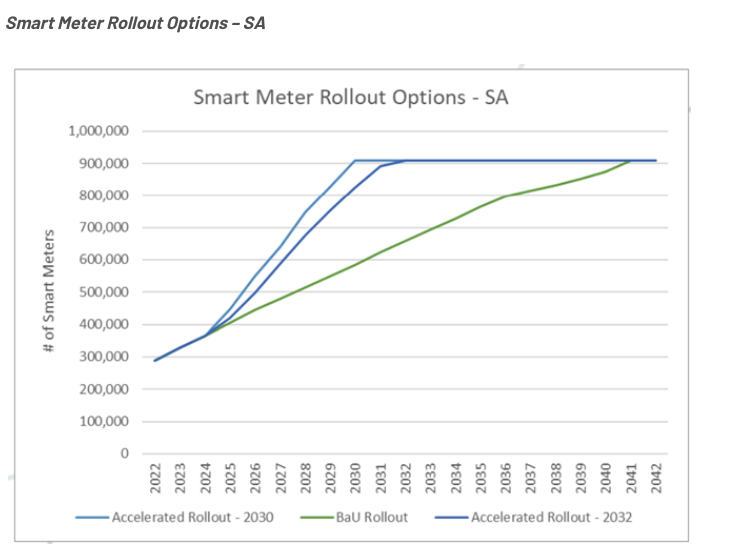
Source: Oakley Greenwood
Household Energy Efficiency Initiatives
Government programmes and incentives promote energy efficiency by encouraging the adoption of energy-efficient appliances and applying upgrades.
- Energy Star Programmes: Offers rebates and incentives for using Energy Star-rated appliances that meet stringent efficiency guidelines.
- Home Energy Upgrade Programmes: These programs offer financial assistance or tax credits to homeowners who make energy-efficient improvements, such as insulation and HVAC updates.
- Solar Panel Rebates: Most states provide rebates for installing solar panels, promoting the adoption of renewable energy, and reducing reliance on traditional sources.
- Low-Interest Loans for Energy Efficiency: Some government programmes offer low-interest loans to support energy-efficient home improvements.
- Educational Resources and Workshops: Governments may provide resources and training for consumers regarding energy efficiency practices.
By taking advantage of these programmes, homeowners can enhance their electricity efficiency and reduce environmental impact.
Commercial Energy Efficiency Programs
Commercial energy efficiency programmes help businesses identify ways to save electricity through comprehensive audits. These audits assess current energy usage and highlight areas that require improvement. Companies can reduce electricity consumption and operating costs by applying recommended upgrades, such as energy-efficient lighting and modern HVAC systems.
Common Electrical Issues and Their Effects on Overall Energy Efficiency
Identifying common electrical issues can promote energy efficiency and reduce electricity bills. Addressing these issues helps optimise system performance and ensure electricity is used effectively.
Electrical System Inefficiencies
Faulty wiring can develop resistance in electrical circuits, leading to energy loss and electricity consumption. Also, old appliances operate less efficiently than their modern counterparts, consuming more electricity to perform the same tasks. These inefficiencies increase homeowners’ costs and strain the electrical system.
Role of Level 2 Electricians in Energy Efficiency
Hiring Level 2 electricians is vital to ensuring the correct installation of smart meters and providing electrical upgrades. Level 2 electricians possess the specialised training and expertise to handle complex electrical systems safely and more efficiently, reducing the risk of errors and leading to increased energy consumption or safety hazards.
Frequently Asked Questions
1. How much electricity does the average Australian household use annually?
As of 2023, the average Australian household consumes approximately 6,400 kWh of electricity annually. This reflects household size, energy efficiency measures, and electrical appliance use.
2. Which state in Australia consumes the most electricity?
New South Wales consumed the most electricity in 2019 at 77.3 terawatt hours. QLD is the second highest at 65.14 terawatt hours.
3. What percentage of Australia’s electricity comes from renewable sources?
Australia’s electricity production from wind and solar in 2020 is at 17%.
4. How can I reduce my household electricity usage?
Reducing household electricity usage contributes to a sustainable environment. Here are practical tips to reduce energy consumption.
- Choose appliances with high energy ratings, including Energy Star-certified products that utilise less electricity than standard ones.
- Install a smart meter to monitor energy usage in real time.
- Smart home devices such as programmable thermostats and plugs can enhance energy usage and remotely control appliances.
- Improve home and building insulation and seal windows and doors to prevent heat loss.
5. What are the trends in electricity prices across Australia?
Electricity prices across Australia have fluctuated recently. Many consumers face rising tariffs due to increased demand, regulatory changes, and the transition to renewable sources.
Conclusion
The trends highlight a growing need for efficient energy as electricity prices increase and residential patterns change toward sustainable prices. Consumers can benefit from professional guidance because of the increasing use of smart technologies and infrastructure upgrades.
Contact Local Electrician Sydney for expert energy audits, system upgrades, and smart meter installations to optimise energy usage and reduce costs. Call us today at 02 9119 1344 to get a free quote!